
Davo’s Botanical Garden
Tasks Undertaken
Data analysis and interpretation, Data selection, Narrative building, Data storytelling
Background:
This individual project encouraged an approach to data visualisation and storytelling beyond the use of graphs, tables and charts. Existing tools like Tableau aid in the creation of data visuals but are not effectively comprehended due to the lack of narratives that could appeal to the emotions of the target audience. As a result, the visualisations that contain a lot of information may come across as being monotonous and overwhelming. Using creative approaches to data storytelling, information can be targeted and conveyed in a manner that appeals to the target audience, making it more understandable.
Dataset and Guiding Questions
The Austlang dataset was primarily used for this project. The dataset is a publicly available resource providing information on languages spoken by the Aboriginal and Torres Strait Islander people. Some of the details provided by the dataset include the name of the language, the group of people it belongs to, the language(s) that it is related to and estimated number of speakers by the years. The dataset has been collated through multiple existing secondary research such as academic journals as well as primary research like recordings.
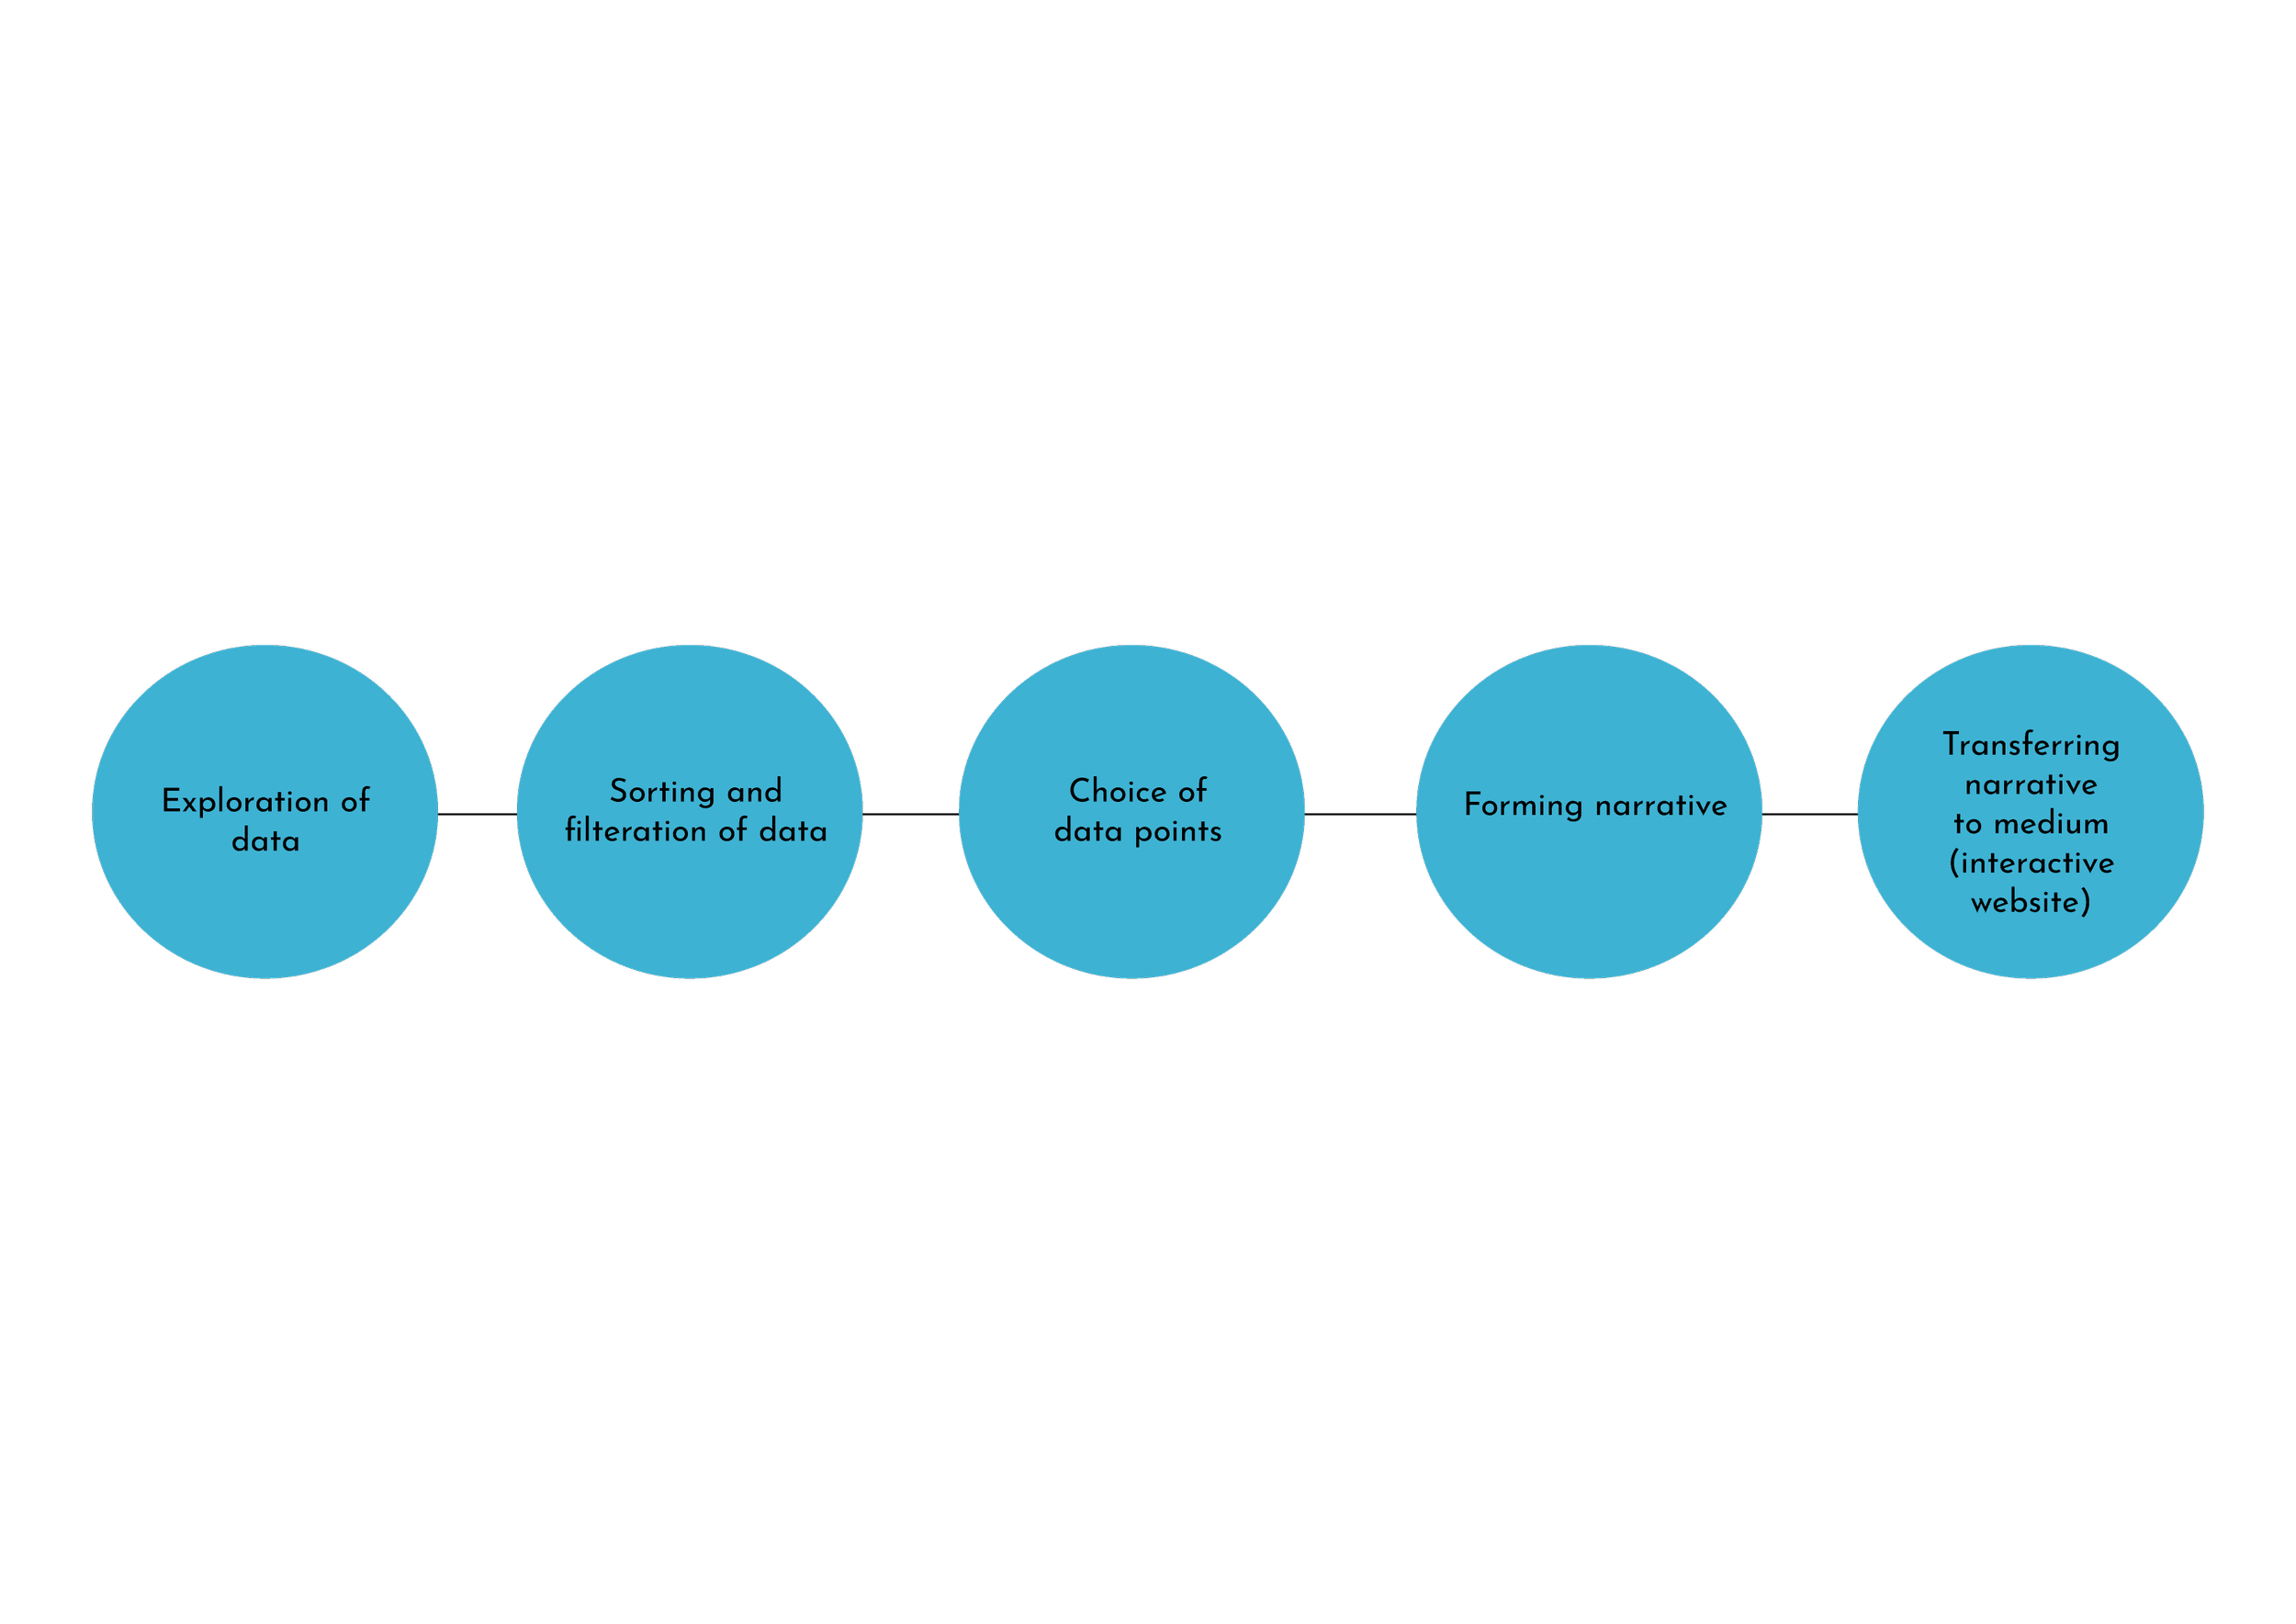
The following questions helped guide my exploration into the dataset and choose parts of the data that I wanted to focus on:
What information is provided by the dataset?
What is wanted to be conveyed through the data story?
What variables from the Austlang dataset are important to be conveyed to target groups?
What data can I combine with the existing dataset to enhance the impact of the intended message?
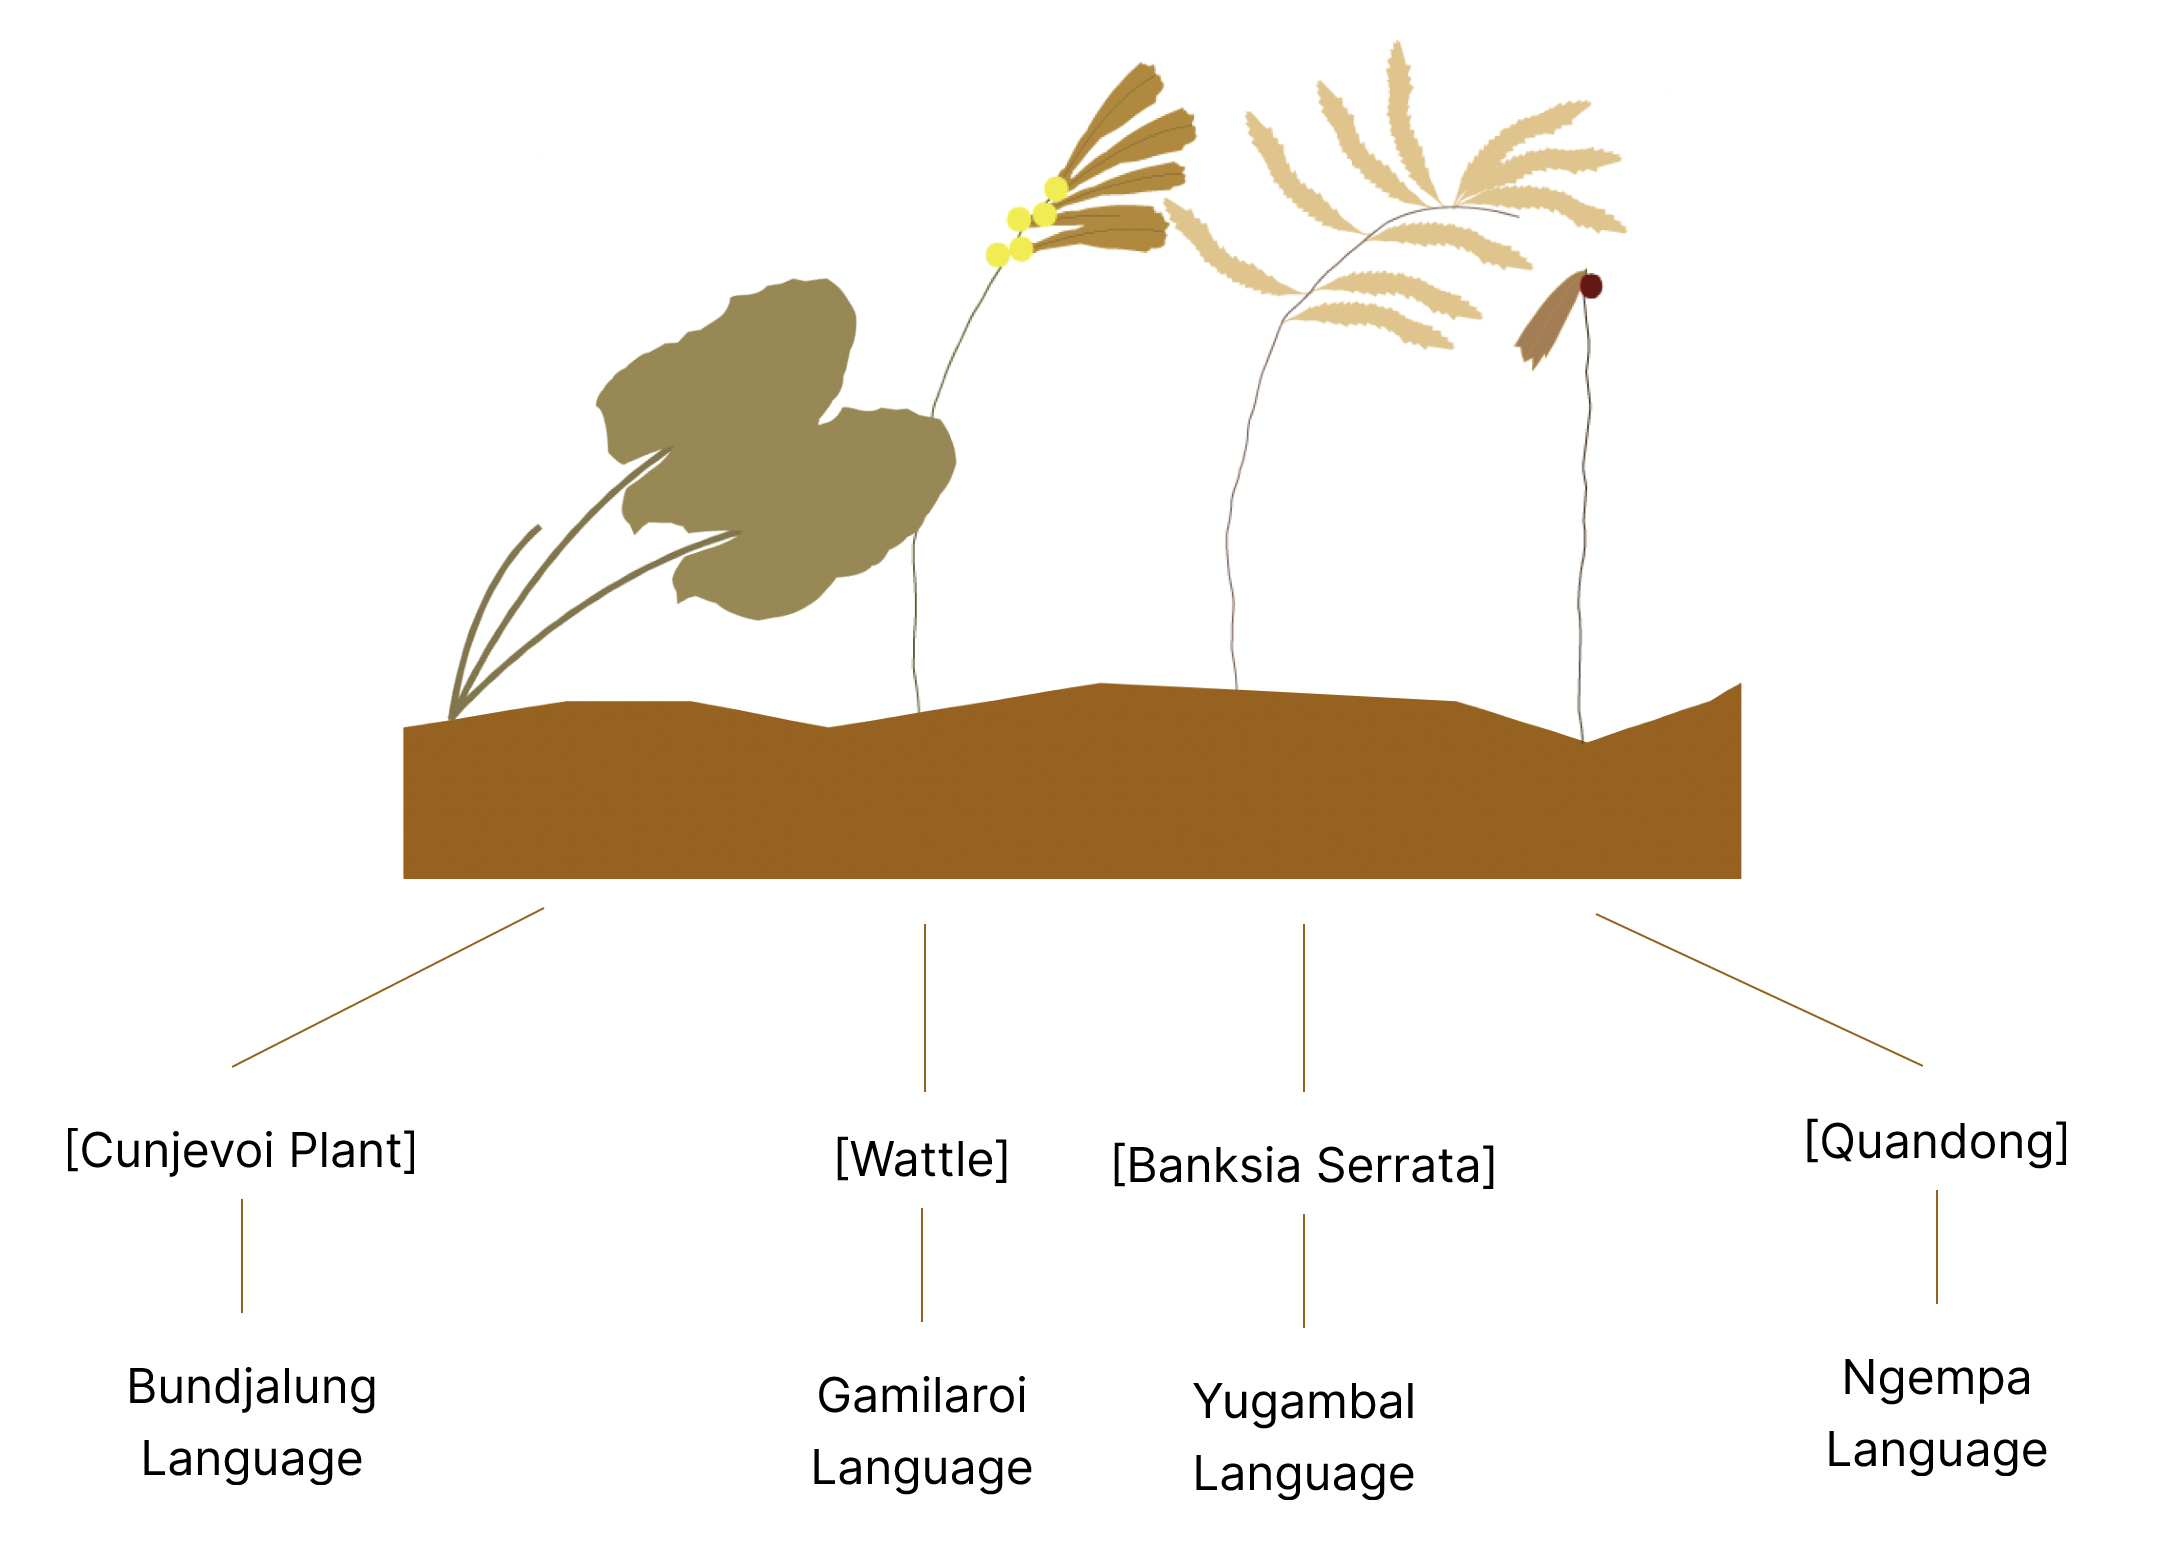
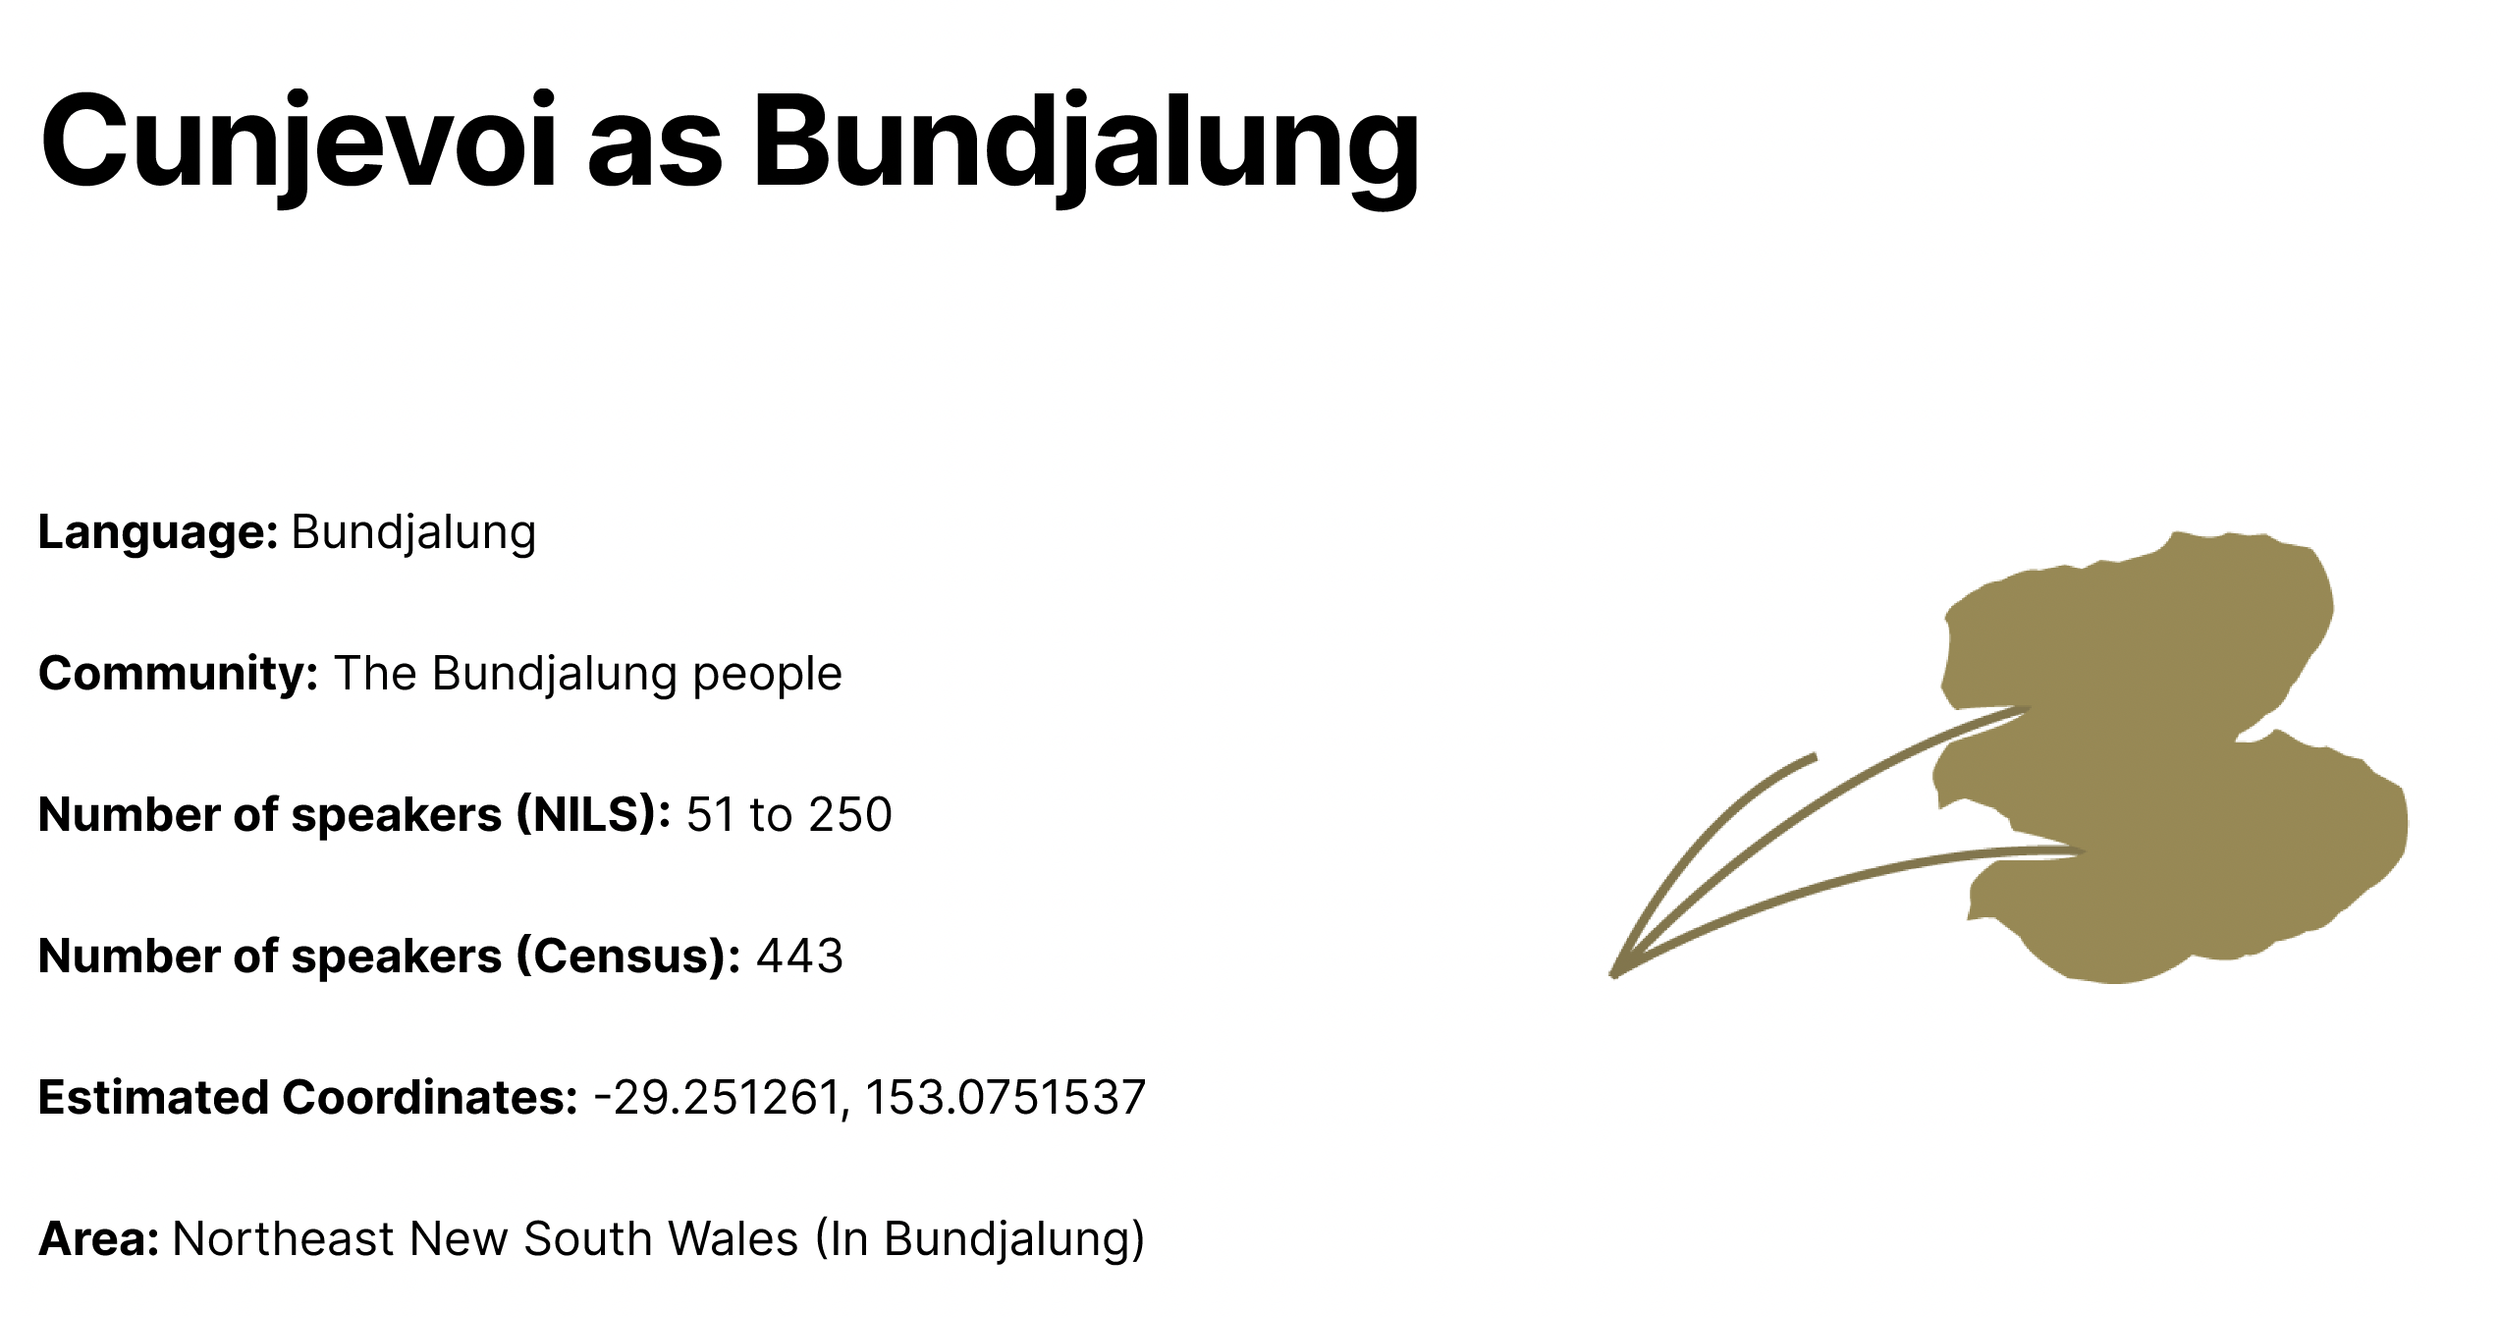
Considering that the dataset related to indigenous Australian communities and understanding their close ties to nature, I decided to build my narrative around nature, correlating selected languages to plants. My objective, through the narrative, was to convey information about certain indigenous languages unique to the state of New South Wales and encourage their exploration and preservation. Within indigenous groups it is common to pass knowledge through generations using different mediums. I have incorporated this concept into my data story through the choice of characters (a young Aboriginal girl and a older man). The choice of bringing about awareness through the character of the young Aboriginal girl is also reflective of the power that lies in the society’s youth in preserving cultural roots.
The languages chosen for the data story were carefully selected after ensuring that different variables related to the language were available within the Austlang dataset or any external, reliable dataset. These variables included community name, language coordinates (estimating the region where the language was/is spoken), number of speakers as per the National Indigenous Languages Survey and plant that has been mentioned as associations to particular indigenous groups.
The narrative was also built keeping in mind certain theoretical concepts that were explored during the course. These included critical interactivity theories, contextualisation of data and Freytag’s narrative pyramid among others.
The data story revolves around a young girl’s exploration of a botanical garden. Her visit to the garden surprises her and she embarks on a journey understanding the importance of preserving plants. In doing so, the narrative correlates the wilting plants in the garden to indigenous languages that are fading away in society, urging the youth to take responsibility in generating awareness and preserving an important aspect of cultural identity.
It is important to note that this data story serves as a foundational exploration of how data can be translated into creative storytelling to increase the impact of messaging more than the visual appeal of the data story medium.
The data story can be accessed through the following link: https://www.figma.com/proto/8D5xZ5I9b899g5qI3rPJwT/Davo-s-Botonical-Garden-DataStory?node-id=2-2418&p=f&t=2QAZW0yo5hvGVGwc-1&scaling=min-zoom&content-scaling=fixed&page-id=0%3A1&starting-point-node-id=2%3A2418
Problem Statement:
How might any information regarding Australian Indigenous languages be conveyed creatively through storytelling, to a target audience?
Process
Tools
Figma, Microsoft Suite
Course Name
Data and Contemporary Media
Project Type
Individual (Course Work)
Year
June 2025
Building the narrative
While the scope of this project was focused on exploring an approach to conveying data through creative narrativisation, it is important to note the following constraints:
The Austlang dataset, while being a very useful tool in encouraging the exploration of indigenous languages, does not provide a lot of information that can be used to compare across languages. The variables were not always consistent across all data points, leading to gaps in the analysis stage of the data. For instance speaker numbers were not available for all languages. Similarly, there was overlapping seen across different variables such as language name and related languages. As a result comparison and correlation was difficult through normal methods of analysis.
The dataset is largely quantitative and scattered within the platform. As a result much of the information had to be manually formatted into a csv or excel file to ensure it suited the needs of the data story and information required for the narrative was easily available.
Given the tools and medium that were used it was not possible to appeal to senses beyond visual cues such as text and color. It would have been interesting to integrate auditory experiences such as using aboriginal instruments. This would have also allowed for increased interactivity. It was difficult to integrate these aspects into the data story primarily due to limited availability of secondary data (since the topic was targeted and related to a specific group it was important to consider data sovereignty and ensure correct and fair representation of information).
Limitations
(Images of visual representations and correlation explanation from the website prototype) - Ravi, Arun (2025) Assessment 3 - Created for Data and Contemporary Media (MDIA5030) - UNSW